The problem01
Influencer campaign reporting is usually a spreadsheet assembled by hand. Someone opens each creator's analytics, copies reach and engagement into cells, and by the time the report is ready the campaign has already moved on.
— Case study 02
Influencer marketing analytics without manual reporting
project overview
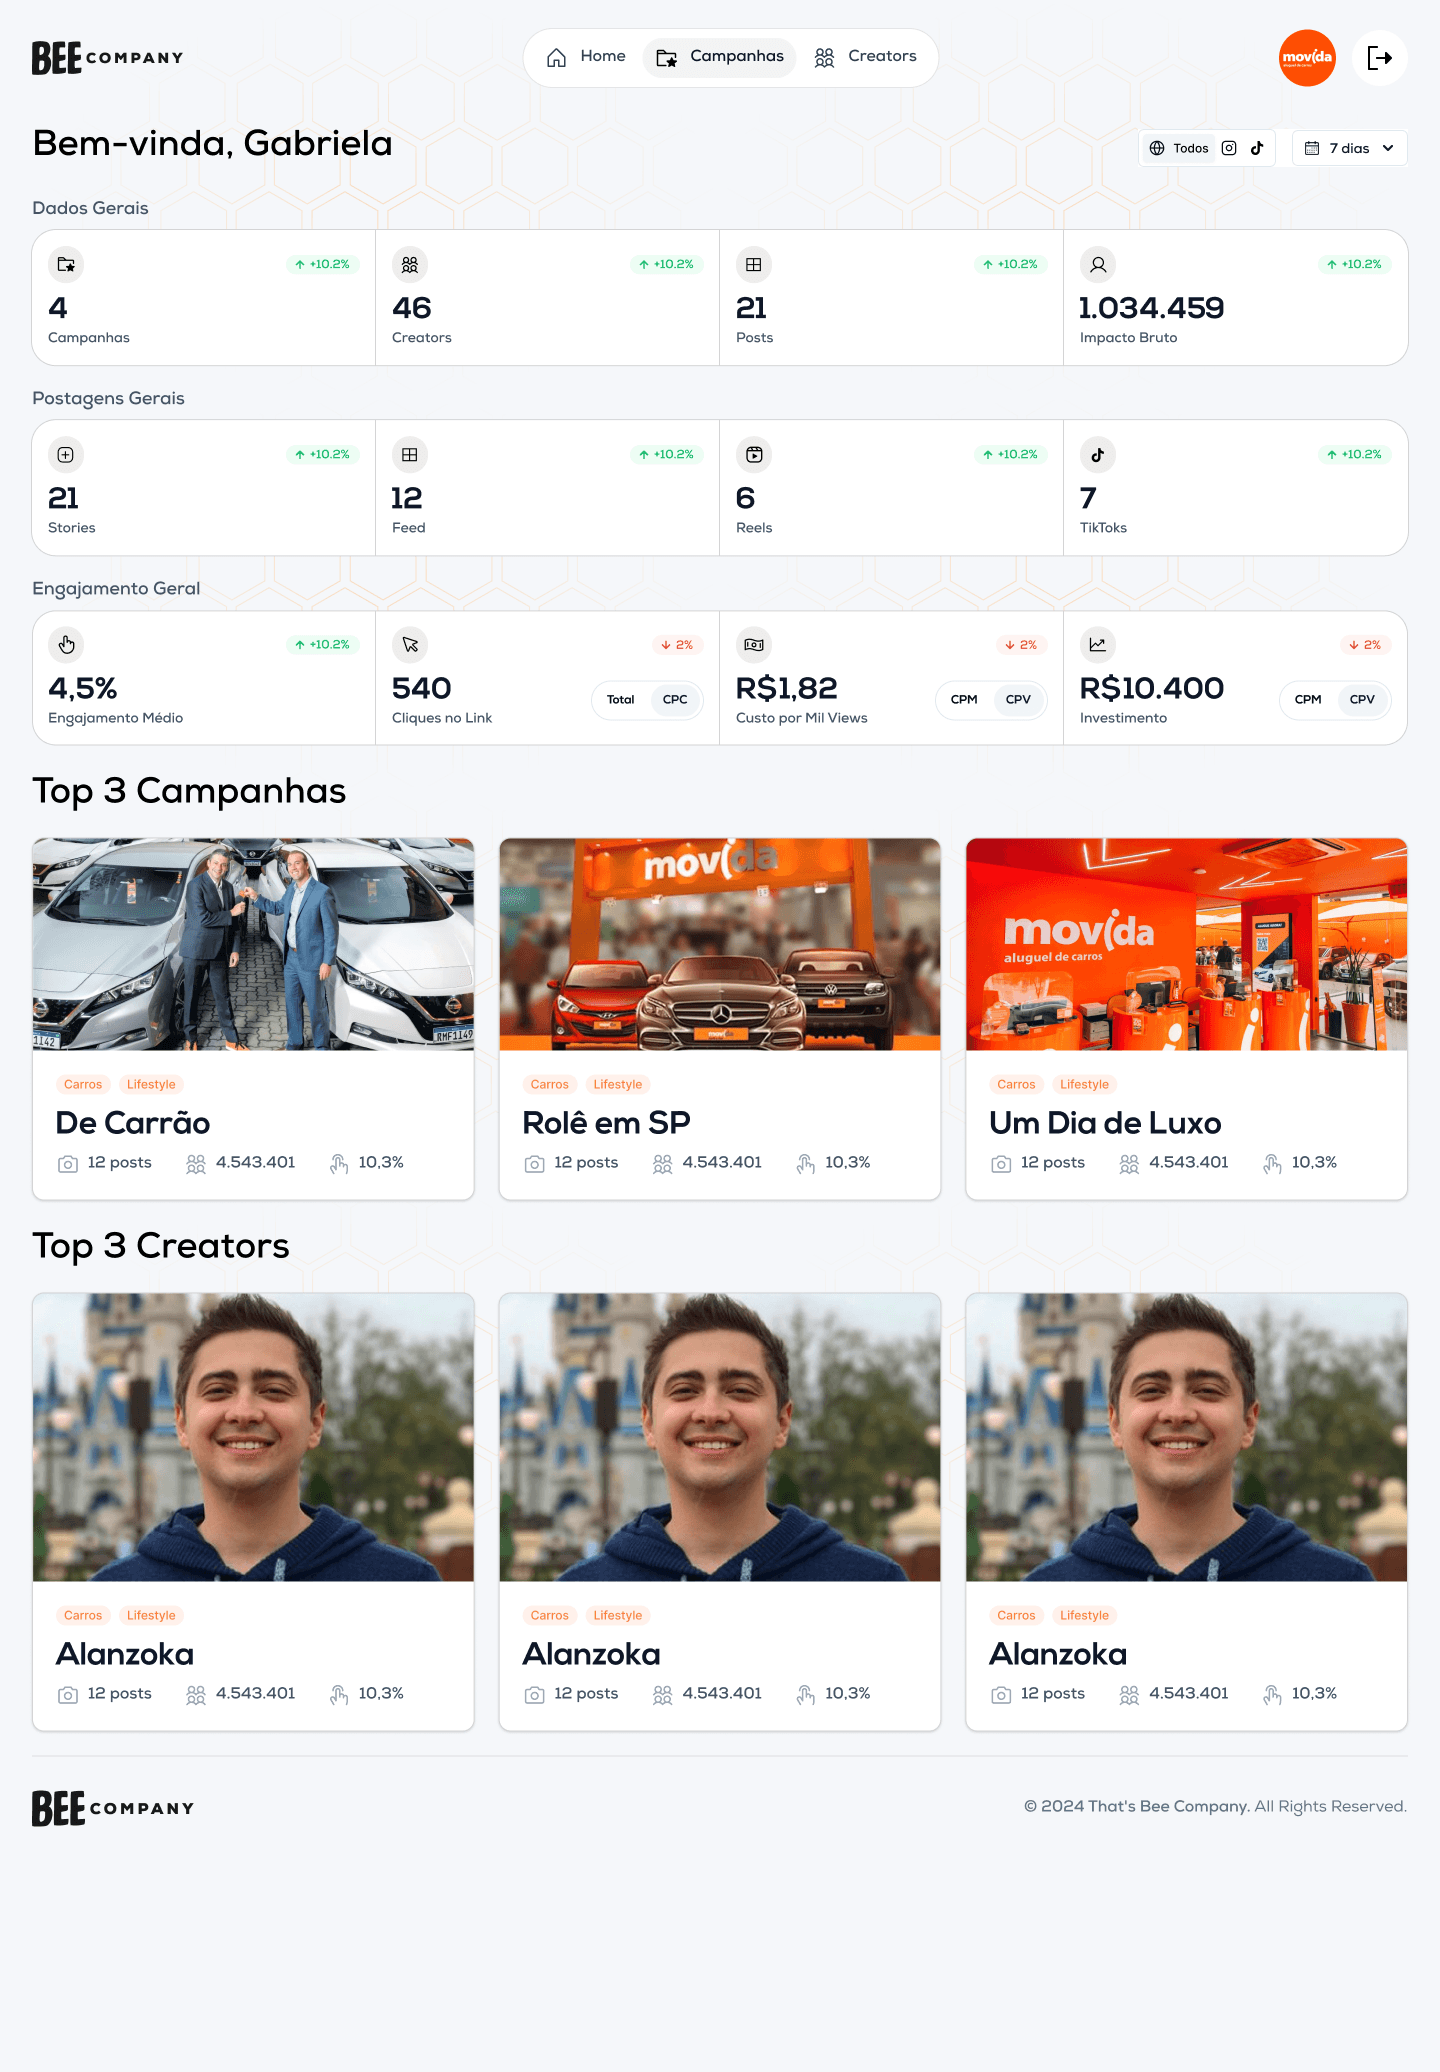
A dashboard for marketing teams that pulls numbers from social media accounts automatically and shows whether a campaign is actually working.
shipped outcome
Campaign performance becomes visible in near real time, with creators compared on equivalent metrics instead of platform-specific vanity numbers.
Influencer campaign reporting is usually a spreadsheet assembled by hand. Someone opens each creator's analytics, copies reach and engagement into cells, and by the time the report is ready the campaign has already moved on.
Bee Dash ingests metrics through social platform APIs, maps incompatible fields into one canonical schema, and renders comparable decision-focused views. The API, client dashboard, and internal admin live in one monorepo with shared types so metric definitions cannot drift silently between applications.
Campaign performance becomes visible in near real time, with creators compared on equivalent metrics instead of platform-specific vanity numbers.
— Interface evidence
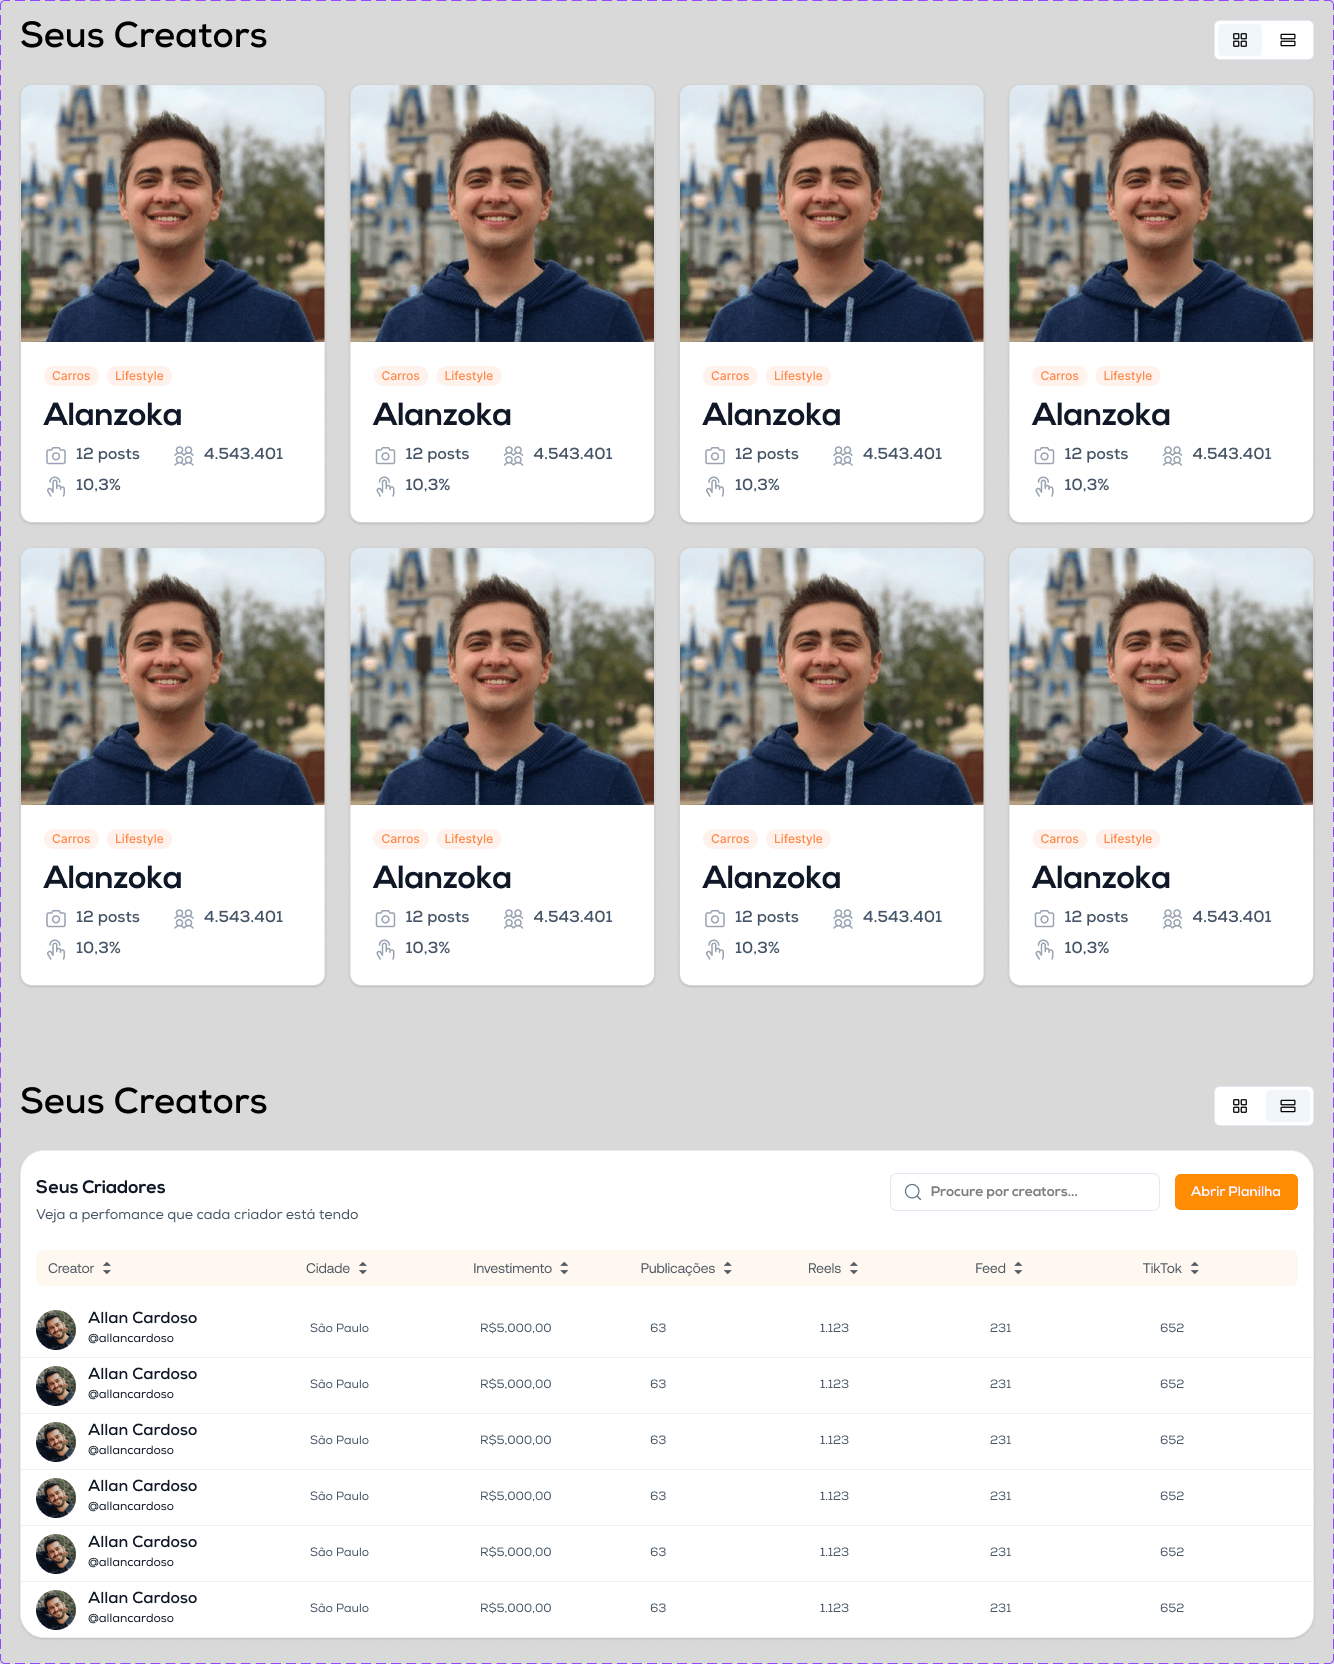
These are the verified interface captures from the project build. Scroll inside taller frames to inspect each complete page.


— Delivery process
The work is sequenced around risk. Domain rules and failure states come before interface polish; automation arrives before handoff.
The team agreed what reach, engagement, and campaign performance mean across platforms before writing platform-specific adapters.
Each social source handles its own authentication, pagination, and rate limits while producing the same normalized output.
Every chart answers a practical question: campaign pacing, creator comparison, renewal value, or best-performing content format.
API, dashboard, and admin consume shared domain types and UI foundations from one workspace.
— System architecture
Each layer has one job and a narrow contract. That keeps external services replaceable and product behavior testable.
reach
2.8m
engagement
8.4%
active
24
Campaign views, creator comparison, filters, and interactive data visualization.
Account, campaign, access, and source management kept separate from the client product.
Modular ingestion, aggregation, scheduling, and access control.
Normalized time-series metrics with typed queries and versioned migrations.
— What shipped
Scheduled adapters pull social data and map it into one stable reporting model.
Creators can be compared on normalized metrics instead of unrelated platform-specific fields.
Teams filter and drill into live reporting rather than receiving another static export.
— Engineering pressure
Ingestion is batched, scheduled, and backed off deliberately rather than retrying blindly.
Adapters isolate API churn so a platform change does not spread into every chart and query.
The schema supports trend queries without turning every dashboard request into a full-history scan.
verified project destinations
next transmission
Bring the operating problem. We will shape it into a clear product brief and a buildable next step.
Start a project