blessed_moon@studio
studio: Blessed Moon Studio
founder: Benito Pedro Xavier · Solo studio
discipline: Strategy · Design · Engineering
stack: Next.js · Tailwind · WebGL
scene: ASCII moon · 5 keyframes
type: Space Grotesk / JetBrains Mono
accent: #ff6a1f
sound: muted
status: ready
B / S / MCASE_17 / 26

— Case study 17

Transit Pulse

A live public-transport map for Rio, honest about which data exists

All work
transit_pulse.capture● verified
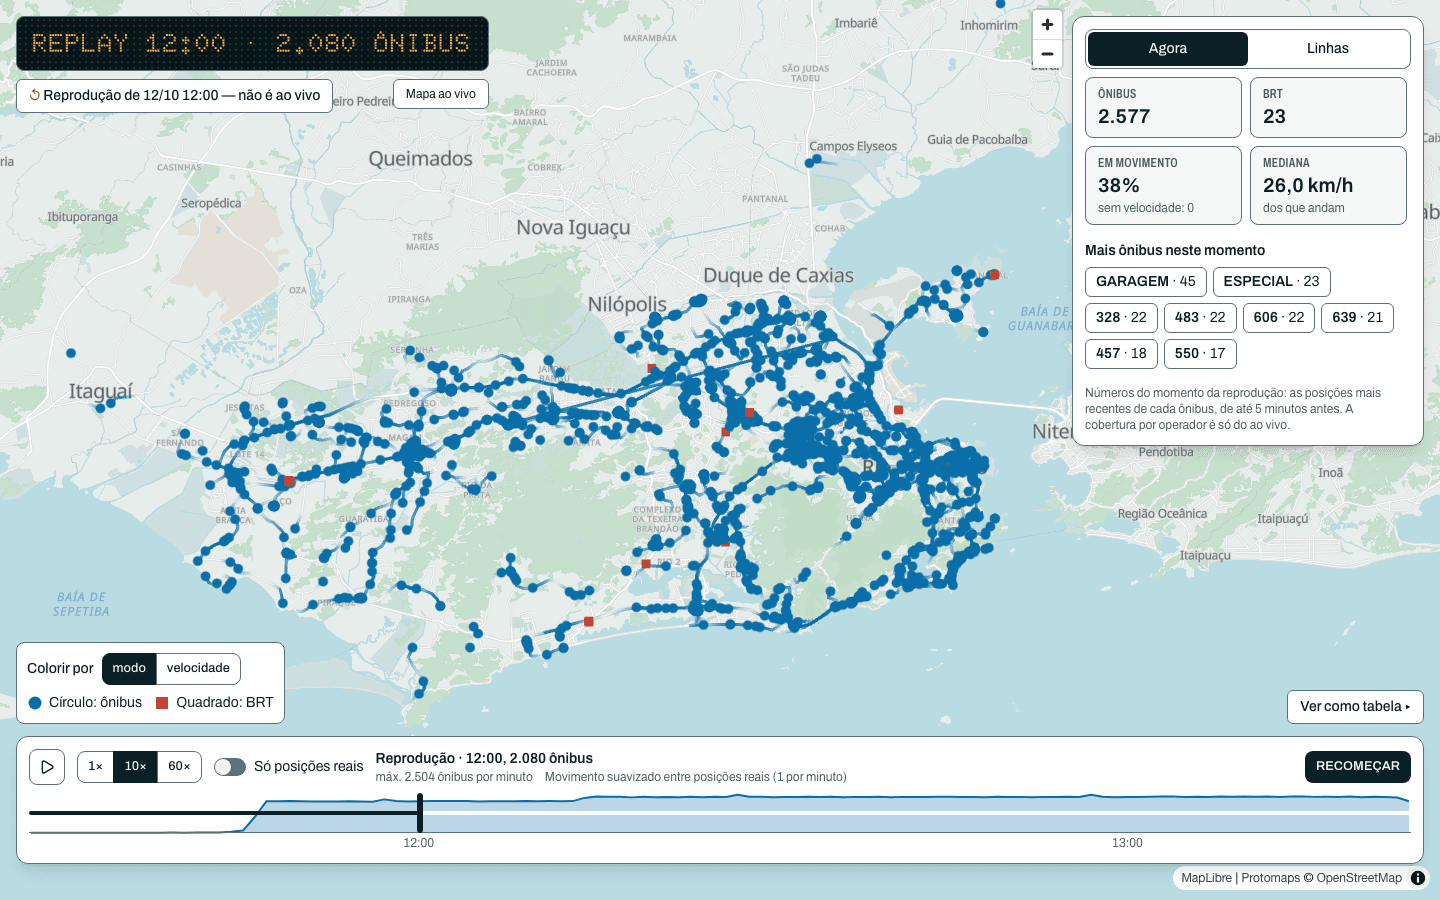
Transit Pulse replay: a MapLibre map of Greater Rio blanketed with buses and BRT at a busy midday minute, an amber letreiro reading REPLAY 12:00 · 2.080 ÔNIBUS, and an 'Agora' stats panel, labelled 'não é ao vivo'

project overview

A live map of Greater Rio's buses and BRT where every operator is shown as live, scheduled-only or no-public-data, fed by a resilient streaming pipeline that records each provider's response byte-for-byte before it ever draws a vehicle.

shipped outcome

A recorded demo that keeps working with the live backend switched off: the real Rio map, line and bus exploration with the view held in the URL, colour-by-speed, static GTFS routes and stop lists for selected lines, and a time machine that scrubs the recorded hours and plays them at 1×/10×/60× with fading trails. The production raw log ships to S3 with checksum manifests, and a separate rebuild job writes the same tables as the live consumer, so a projection lost to a crash is reproduced exactly from the log.

Role
Data platform and product engineering
Timeline
2026 — recorded demo live
Year
2026
Team
Solo

The site in motion

A silent tour of the recorded demo at a busy midday minute — over two thousand buses and BRT across Greater Rio, shown in both light and dark — with its honest 'not live' letreiro: 60× playback through the recorded hours, the fleet coloured by speed, and line 324's static GTFS route and stops. Runs with the live backend switched off.
The problem01

Rio has no single source for where its transit is. Three public SMTR paths cover the city's buses and BRT; the trains, metro, tram, ferries and intercity buses have no public machine-readable data at all. A naive map would paper over that — inventing positions, collapsing a failed fetch into 'no vehicles', or drawing a days-old parked snapshot as a moving bus.
The approach02

One adapter per provider normalizes to a single canonical event; nothing downstream knows which provider it came from. Every response is written to an immutable raw log on S3 before anything is published, so the broker (Redpanda, 24-hour retention) is only a buffer and the database is a rebuildable projection. The API serves a snapshot from memory — it queries the database at most once per new minute, never per request — and the web app draws vehicles with MapLibre and deck.gl behind an amber letreiro that states live, stale or failed plainly. Coverage is shown in three honest tiers, and within 'live', 'no vehicles', 'fetch failed' and 'stale past five minutes' stay distinct, never zero.

The result03

A recorded demo that keeps working with the live backend switched off: the real Rio map, line and bus exploration with the view held in the URL, colour-by-speed, static GTFS routes and stop lists for selected lines, and a time machine that scrubs the recorded hours and plays them at 1×/10×/60× with fading trails. The production raw log ships to S3 with checksum manifests, and a separate rebuild job writes the same tables as the live consumer, so a projection lost to a crash is reproduced exactly from the log.

— Interface evidence

The product, not a placeholder

These are the verified interface captures from the project build. Scroll inside taller frames to inspect each complete page.

The replay map of Greater Rio at midday, the whole fleet on screen: buses (circles) and BRT (squares), the amber letreiro, and an 'Agora' panel with fleet stats — marked 'não é ao vivo'01 / 04
The replay map of Greater Rio at midday, the whole fleet on screen: buses (circles) and BRT (squares), the amber letreiro, and an 'Agora' panel with fleet stats — marked 'não é ao vivo'
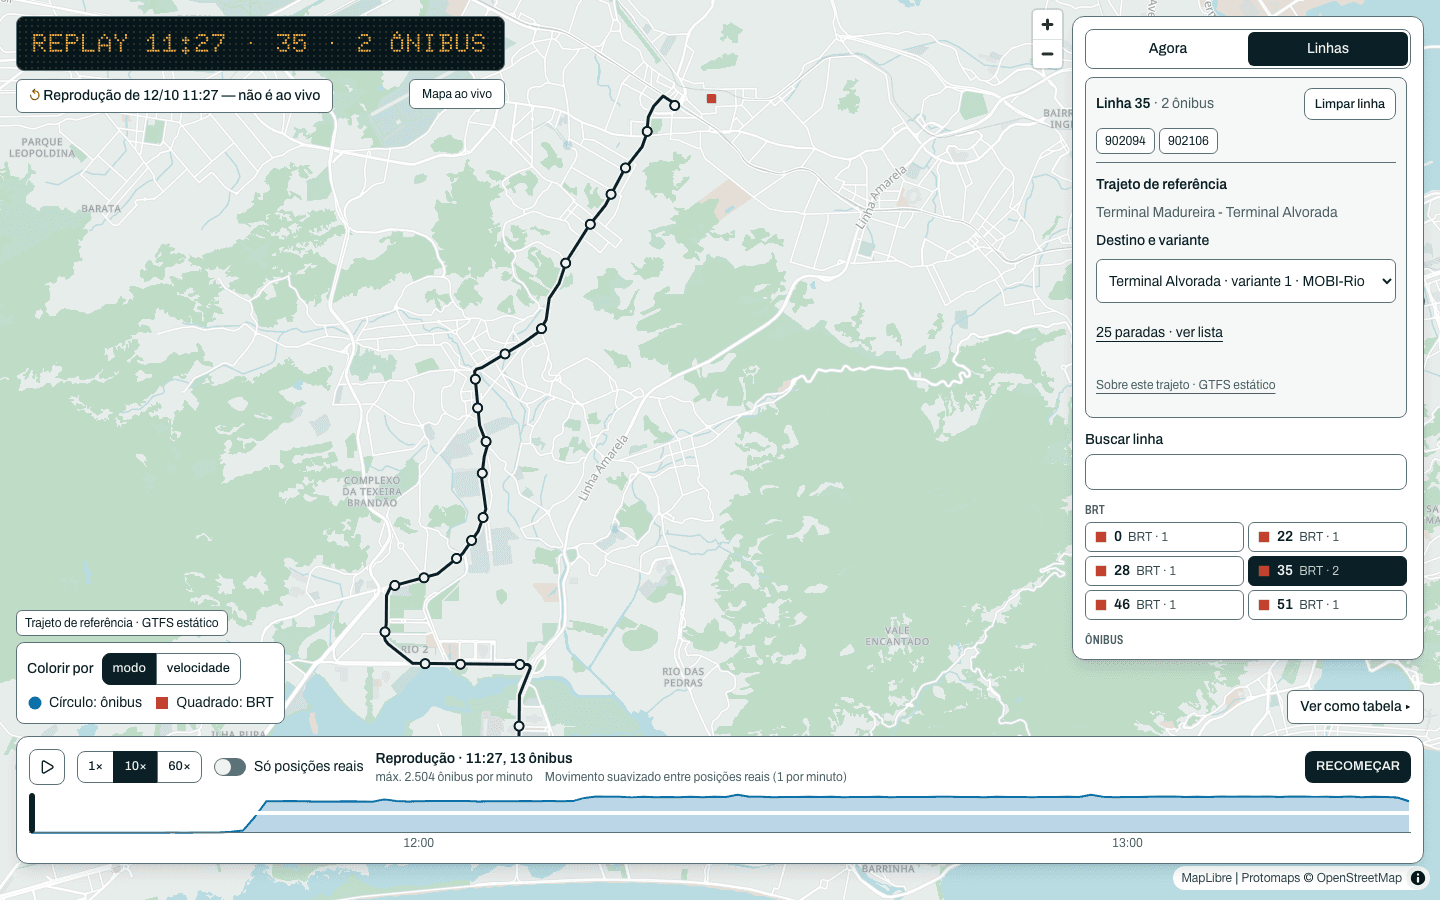
Line 35 selected: its GTFS reference route from Terminal Madureira to Terminal Alvorada drawn on the map, with destination variants and a 25-stop list in the Linhas panel02 / 04
Line 35 selected: its GTFS reference route from Terminal Madureira to Terminal Alvorada drawn on the map, with destination variants and a 25-stop list in the Linhas panel
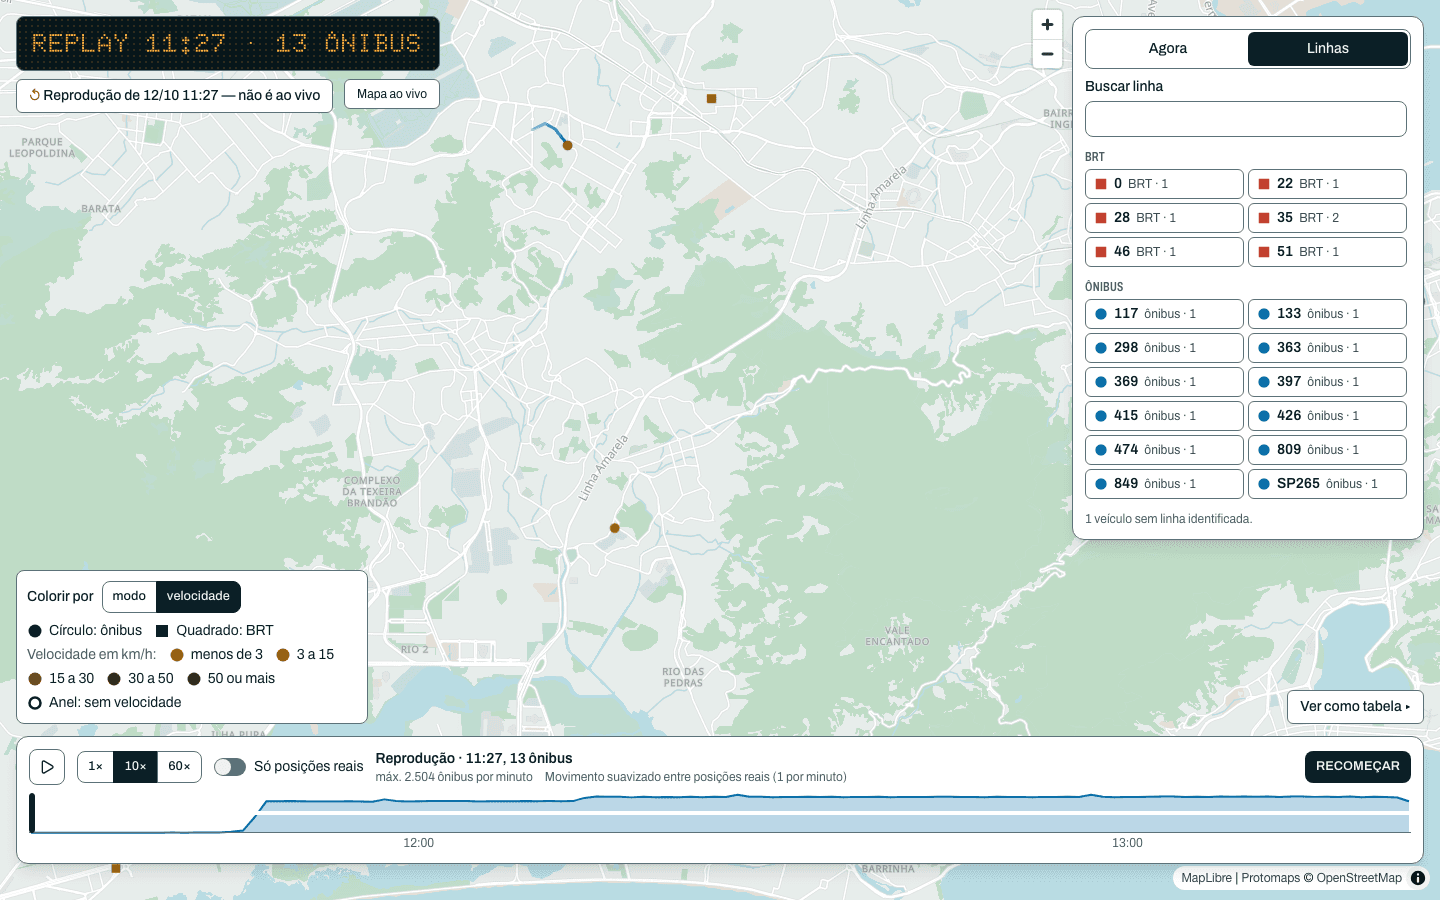
The fleet coloured by speed, with the km/h legend (a ring means no speed reported), over the full line index in the Linhas panel03 / 04
The fleet coloured by speed, with the km/h legend (a ring means no speed reported), over the full line index in the Linhas panel
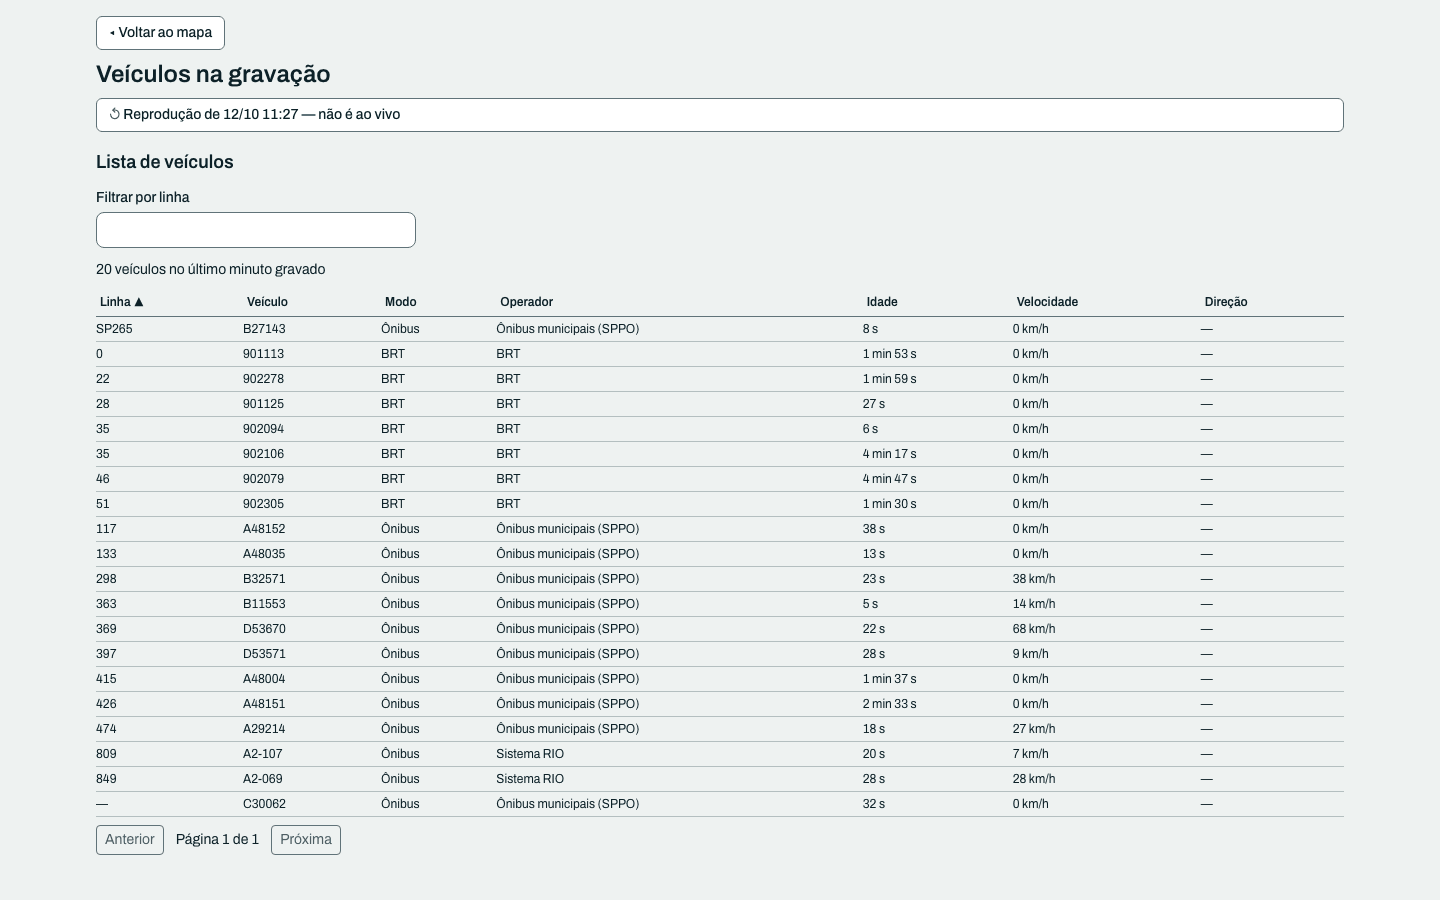
The non-map alternative at /tabela: a table of vehicles in the recording — line, vehicle, mode, operator, age, speed and heading04 / 04
The non-map alternative at /tabela: a table of vehicles in the recording — line, vehicle, mode, operator, age, speed and heading

— Delivery process

From operating constraint to shipped system

The work is sequenced around risk. Domain rules and failure states come before interface polish; automation arrives before handoff.

01

A truthful source inventory

Every Rio operator checked against live sources: city buses (SPPO and the new Sistema RIO) and BRT are public through three keyless SMTR paths; rail, metro, tram, ferries and intercity buses have no public machine-readable data. The map says so rather than guessing.

02

One canonical event

An adapter polls the ITS API one UTC minute at a time, stores each response byte-for-byte in the raw log, and publishes a single versioned event shape to Redpanda — the supplier made part of a vehicle's identity after two AVL suppliers were found reusing the same id.

03

Rebuildable projections

A consumer writes positions and feed-status to TimescaleDB; a separate rebuild job replays the raw log into the same tables through the same code, idempotently, so live and rebuilt tables match. The API answers from an in-memory snapshot, never a per-request query.

04

The screen, and a time machine

A full-bleed Rio map with the letreiro, line and bus panels whose view lives in the URL, static GTFS routes, a non-map table, and a timeline that scrubs and plays the recorded hours with fading trails — then a static replay exported to S3 and CloudFront that outlives the backend.

— System architecture

Clear boundaries, explicit responsibilities

Each layer has one job and a narrow contract. That keeps external services replaceable and product behavior testable.

GoRedpandaTimescaleDB + PostGISNext.jsMapLibredeck.glTypeScriptAWS S3 + CloudFront
transit_pulse.syssystem schematic

letreiro / rio

live · stale · failed

no vehicles ≠ fetch failed

api snapshot

from memory · 1 query / min

●recorded before it's drawn

coverage / 3 tiers

ônibus · brt · live[x]
gtfs routes · scheduled[x]
rebuilt from raw log[x]
trem · metrô · barcas[ ]
invented positions[ ]
raw log → redpanda → timescale
Ingest

Go adapters

One adapter per provider, each emitting one canonical event; the raw provider response is written to S3 before anything is published.

Broker

Redpanda

Versioned topics for positions and feed-status; the broker is a 24-hour buffer, the raw log on S3 is the system of record.

Storage

TimescaleDB + PostGIS

A positions hypertable and a feed-status table; the live consumer and the rebuild job share one idempotent, order-independent write path.

Serve

Go API + Next.js

The API answers from an in-memory snapshot refreshed at most once per minute; the web app draws it with MapLibre and deck.gl, with a static replay on CloudFront.

— What shipped

Product capabilities

01

Honest coverage, in three tiers

Every operator is live, scheduled-only or no-public-data; within live, 'no vehicles', 'fetch failed' and 'stale past five minutes' are each shown as themselves, never collapsed into zero.

02

A time machine over recorded hours

Scrub the last hours and play them at 1×/10×/60× with fading trails; the playhead minute lives in the URL, and 'Só posições reais' turns off the interpolation between real fixes.

03

A replay that outlives the backend

The deployed demo runs entirely from a compact, checksum-pinned export on S3 and CloudFront — the live pipeline can be switched off and the recording still plays.

— Engineering pressure

Challenges resolved

01

The same bus reported twice

Two AVL suppliers reported the same SPPO vehicle id from different devices — 3,114 colliding (vehicle, time) pairs with different positions. Resolved by making the supplier part of a vehicle's identity, so neither fix is silently dropped.

02

A timestamp that lied about its zone

The legacy SPPO feed stamps positions with a 'Z' that is not UTC — it is São Paulo time. Each source's clock is converted explicitly to real UTC in the adapter, so the time machine scrubs the right minute.

03

'Real-time' over polled sources

Nothing is pushed; the adapter polls one minute at a time and the map interpolates between the real fixes. The product says so plainly — the honesty is the feature, and the streaming rigour lives in the pipeline.

next transmission

Need a system this deliberate?

Bring the operating problem. We will shape it into a clear product brief and a buildable next step.

Start a project