The problem01
DNS logs show requested domains but miss connections that have no matching DNS trail. Understanding network activity requires both views, with a clear distinction between observed traffic and missing coverage.
— Case study 22
DNS queries and passive connection logs, joined into a readable network picture
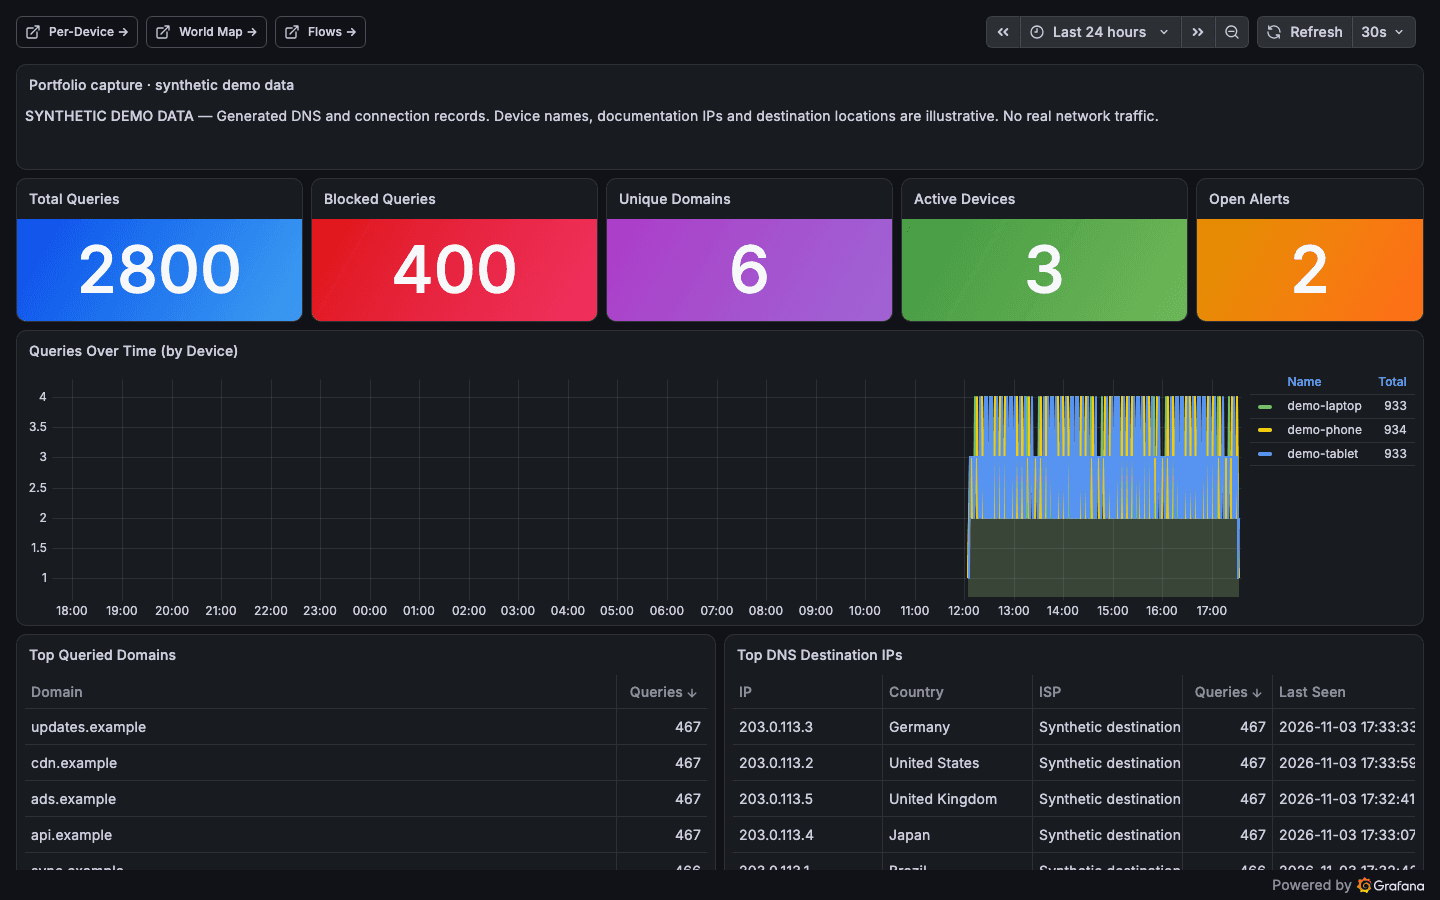
project overview
A home-network telemetry system combining AdGuard Home DNS logs, passive Zeek connection records, PostgreSQL and MaxMind geolocation. Grafana presents queries, destinations, flows and alerts. The screenshots use generated demo records only.
shipped outcome
The source includes DNS ingestion, passive flow mapping, anomaly checks and four provisioned dashboards. For this case study, an isolated Grafana and PostgreSQL instance renders synthetic DNS, flow and geolocation records. No home-network sensor or real device data was used.
DNS logs show requested domains but miss connections that have no matching DNS trail. Understanding network activity requires both views, with a clear distinction between observed traffic and missing coverage.
A NestJS collector polls AdGuard logs and tails Zeek connection and TLS logs. It maps devices, deduplicates events and enriches public destinations through a cached MaxMind lookup. PostgreSQL keeps DNS and flow records separately; provisioned Grafana dashboards query both.
The source includes DNS ingestion, passive flow mapping, anomaly checks and four provisioned dashboards. For this case study, an isolated Grafana and PostgreSQL instance renders synthetic DNS, flow and geolocation records. No home-network sensor or real device data was used.
— Interface evidence
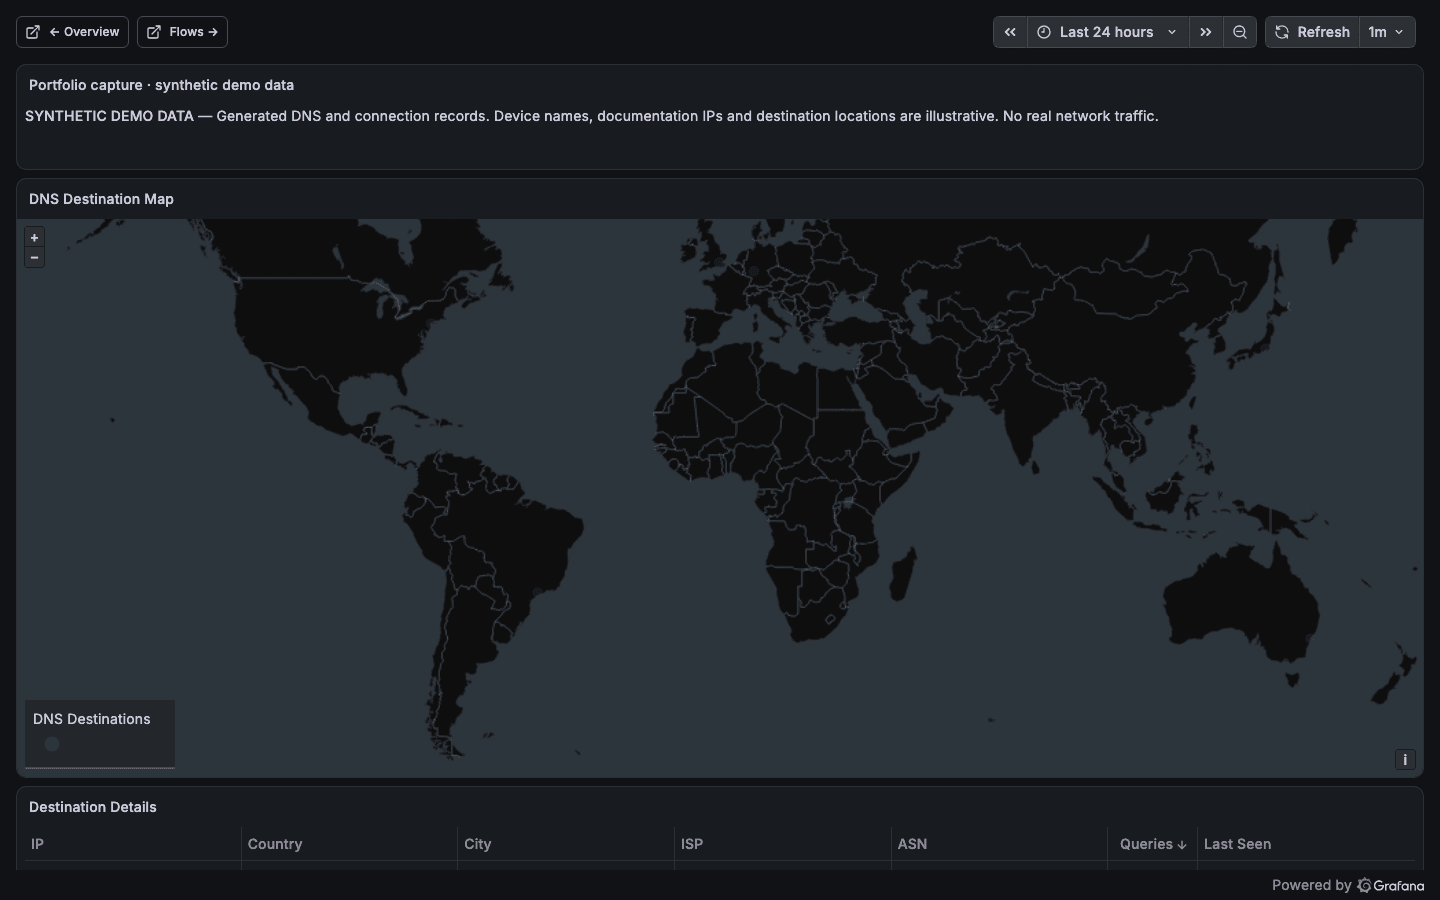
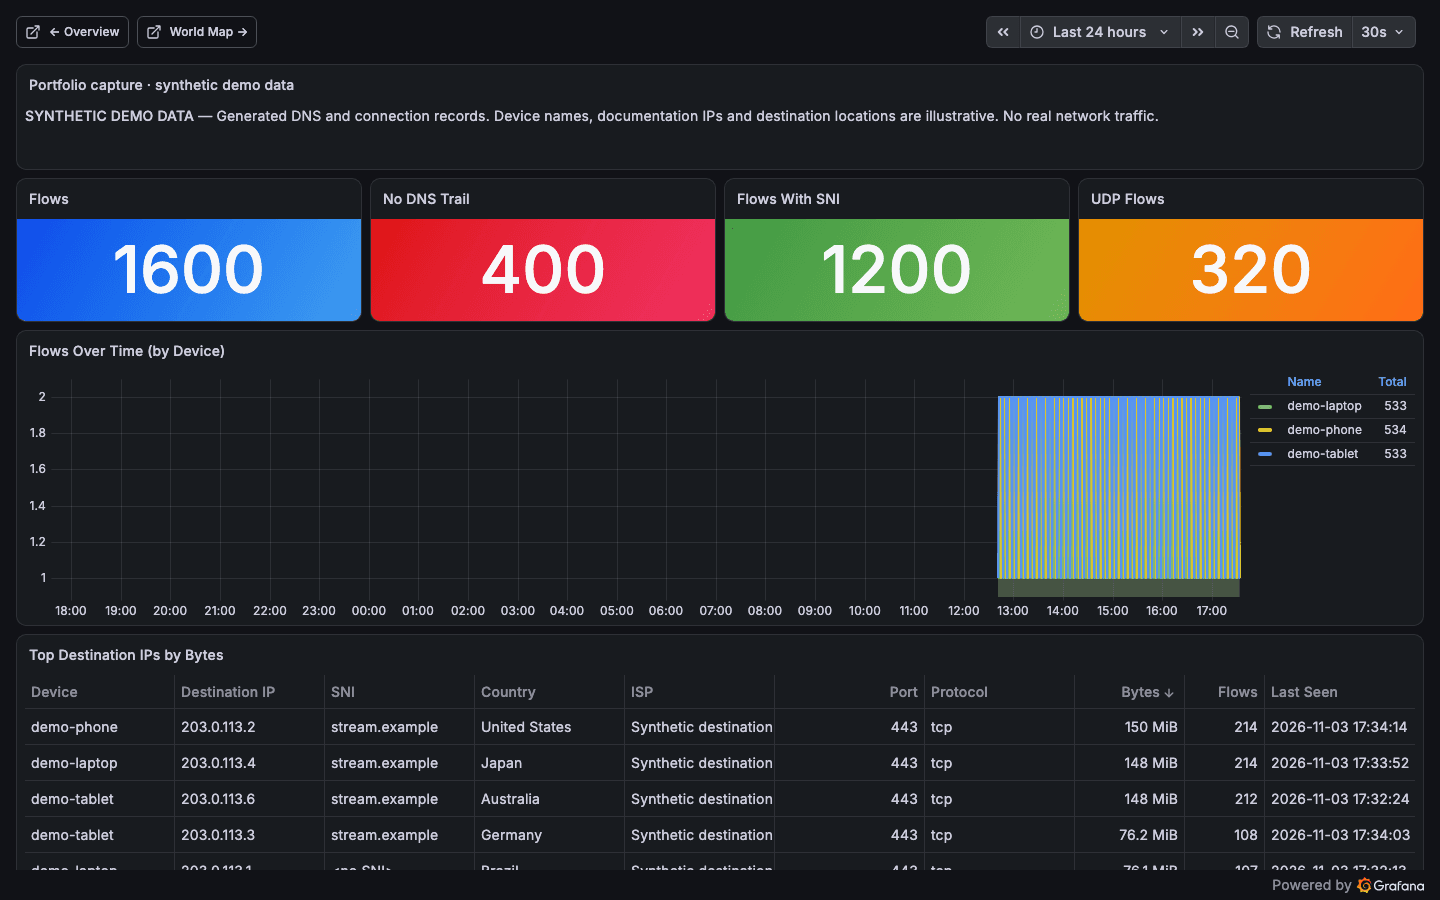
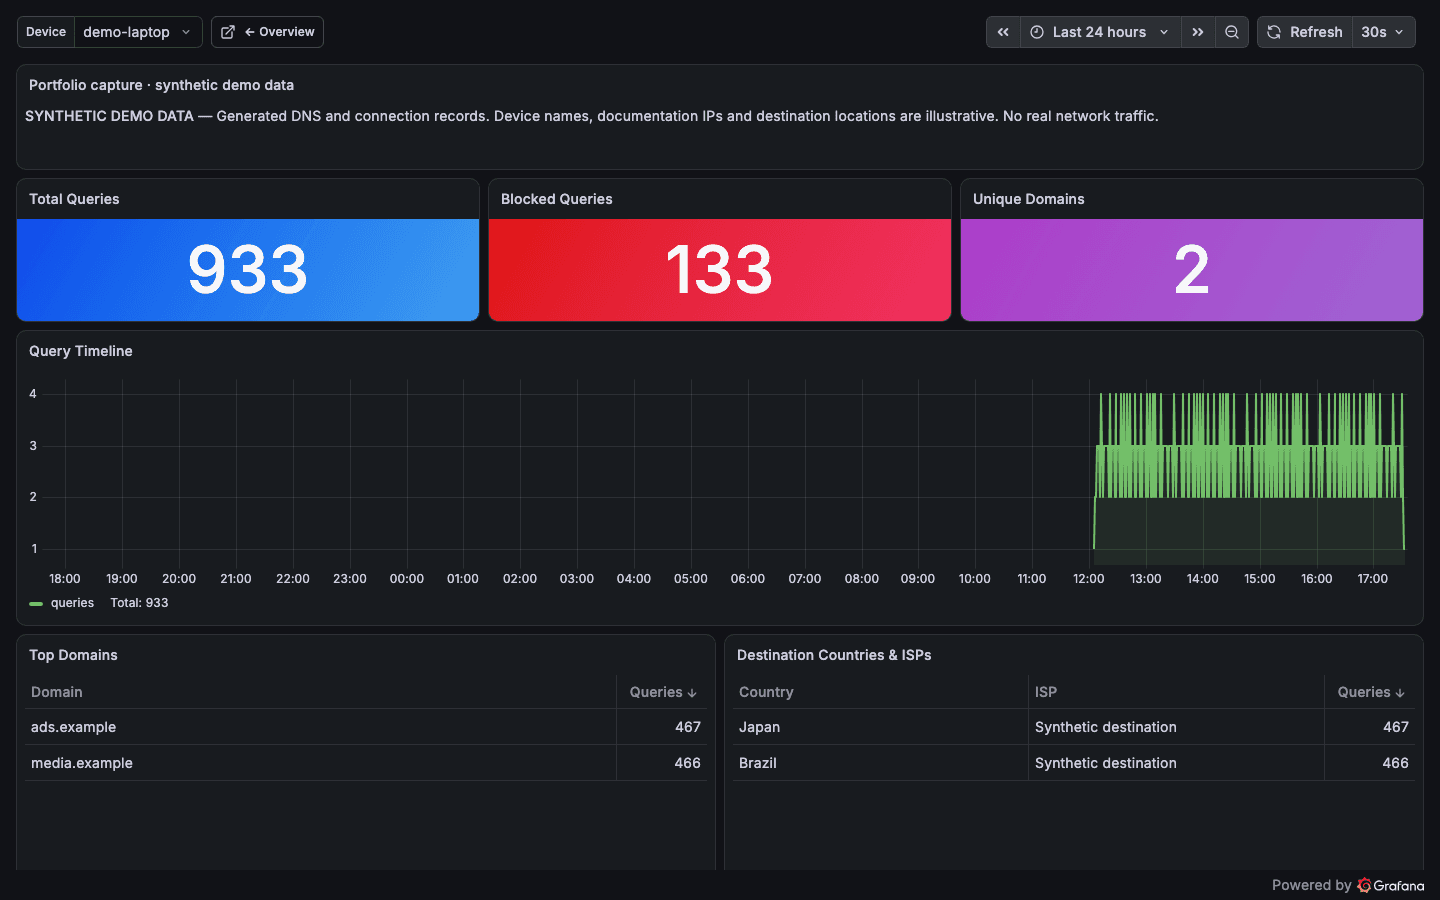
These are the verified interface captures from the project build. Scroll inside taller frames to inspect each complete page.
— Delivery process
The work is sequenced around risk. Domain rules and failure states come before interface polish; automation arrives before handoff.
Poll AdGuard queries and associate them with registered device identities.
Read Zeek connection and TLS logs to cover traffic that DNS alone cannot explain.
Cache IP geolocation and ASN lookups before joining them into dashboard queries.
Capture the real dashboards against generated records, with a visible synthetic-data banner.
— System architecture
Each layer has one job and a narrow contract. That keeps external services replaceable and product behavior testable.
two observation paths
DNS
AdGuard Home
Flows
Zeek · TLS / UDP
queries ≠ all connections
join / enrich / read
captures: synthetic data only
Query logs provide domains, client addresses and blocked-query status.
Connection and TLS metadata add protocols, bytes and available server names.
Collectors map devices, deduplicate records and cache destination enrichment.
Overview, device, destination-map and flow views use committed SQL queries.
— What shipped
Separate records expose both domain queries and observed internet-egress flows.
Cached location and ASN fields support a map and destination detail tables.
Source-defined checks flag frequent domains and connections without a recent DNS match.
— Engineering pressure
A connection can exist without a visible DNS query; the flow view preserves that distinction.
Docker Desktop relays hide original client addresses, so the source uses native AdGuard for device attribution.
Documentation IP ranges, demo device names and generated events keep the portfolio independent of private traffic.
verified project destinations
next transmission
Bring the operating problem. We will shape it into a clear product brief and a buildable next step.
Start a project