blessed_moon@studio
studio: Blessed Moon Studio
founder: Benito Pedro Xavier · Solo studio
discipline: Strategy · Design · Engineering
stack: Next.js · Tailwind · WebGL
scene: ASCII moon · 5 keyframes
type: Space Grotesk / JetBrains Mono
accent: #ff6a1f
sound: muted
status: ready
B / S / MCASE_12 / 26

— Case study 12

Renewable Pulse

A live instrument panel for renewable electricity, built only on real grid data

All work
renewable_pulse.capture● verified
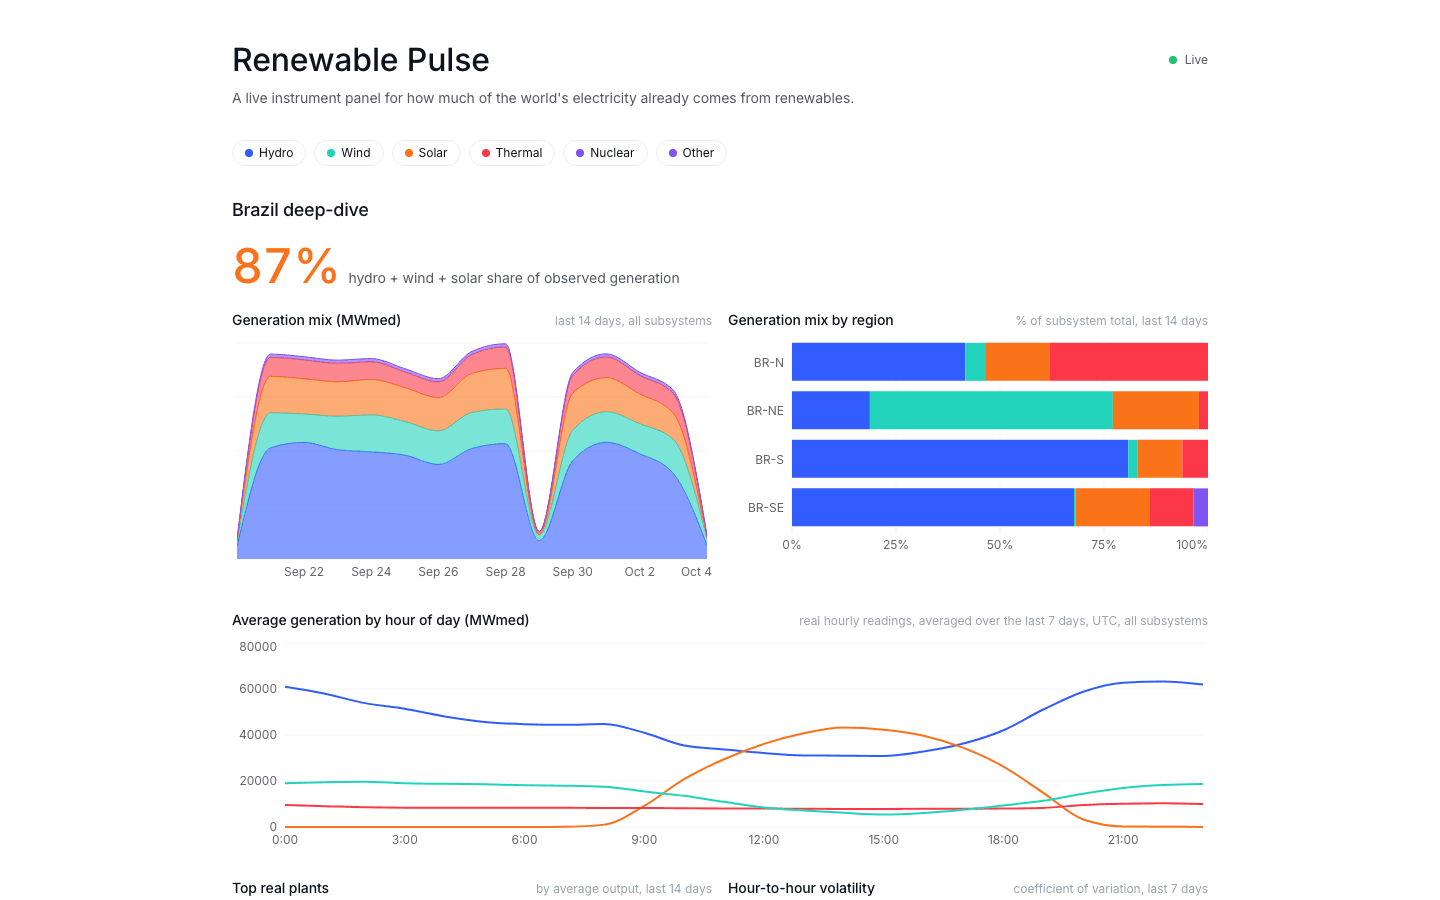
Renewable Pulse dashboard: Brazil's renewable share at 87%, generation mix over time and by region

project overview

A live dashboard of how much electricity already comes from renewables, starting with Brazil's hydro-heavy grid and comparing it with Europe and the USA, fed by a failure-resistant streaming pipeline over real public data.

shipped outcome

Live, with Brazil, Europe and USA deep-dives, a plant registry map, country comparison and a pipeline-health panel showing the dead-letter queue and the last successful poll per source. The ONS spine ingested 366,336 real plant/hour readings with zero duplicates on replay.

Role
Data platform and product engineering
Timeline
Ongoing — live
Year
2026
Team
Solo
The problem01

Grid operators publish generation data, but in different formats, cadences and units: Brazil's ONS by plant and hour, ENTSO-E in 15 to 60-minute series for European zones, the EIA hourly for the USA. Turning that into one comparable, trustworthy picture means a pipeline that survives bursty batches, malformed rows and replays, without ever filling a gap with invented numbers.
The approach02

A Go ingestion edge polls each source and normalizes it to one canonical event schema; Redpanda carries the events to idempotent TypeScript consumers that write to TimescaleDB, keyed on source, zone, asset, metric and timestamp, with a dead-letter queue and bounded backpressure. A separate live consumer fans readings out over WebSocket to the Next.js dashboard. The README states plainly that the sources are polled, not pushed: the real-time character comes from the pipeline, not the data.

The result03

Live, with Brazil, Europe and USA deep-dives, a plant registry map, country comparison and a pipeline-health panel showing the dead-letter queue and the last successful poll per source. The ONS spine ingested 366,336 real plant/hour readings with zero duplicates on replay.

— Interface evidence

The product, not a placeholder

These are the verified interface captures from the project build. Scroll inside taller frames to inspect each complete page.

Brazil deep-dive: renewable share, generation mix by time and by region, average by hour of day01 / 03
Brazil deep-dive: renewable share, generation mix by time and by region, average by hour of day
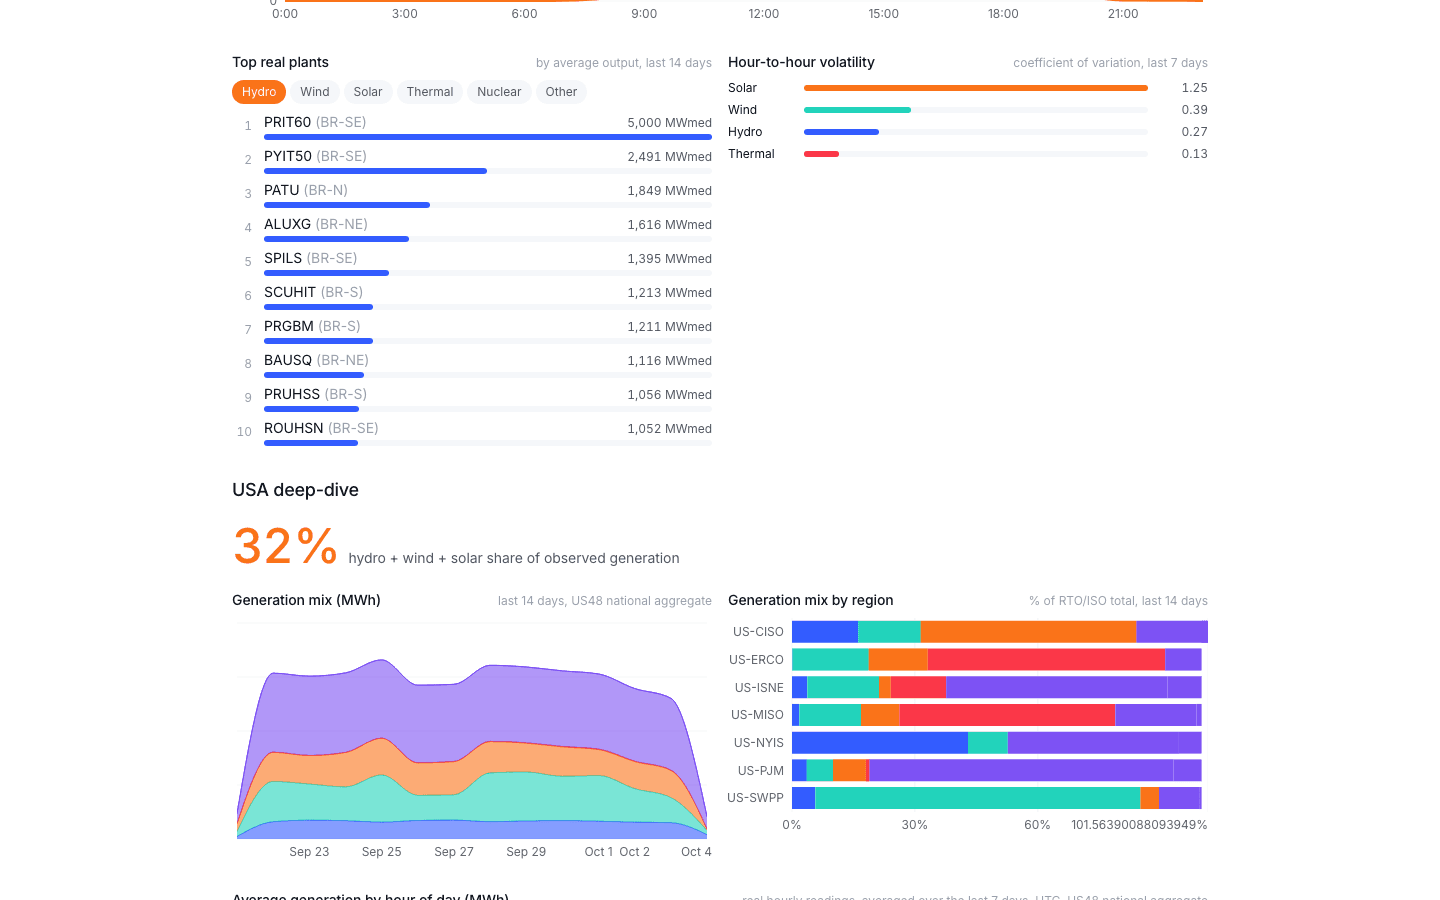
Top real plants and the USA deep-dive across seven regional grid operators02 / 03
Top real plants and the USA deep-dive across seven regional grid operators
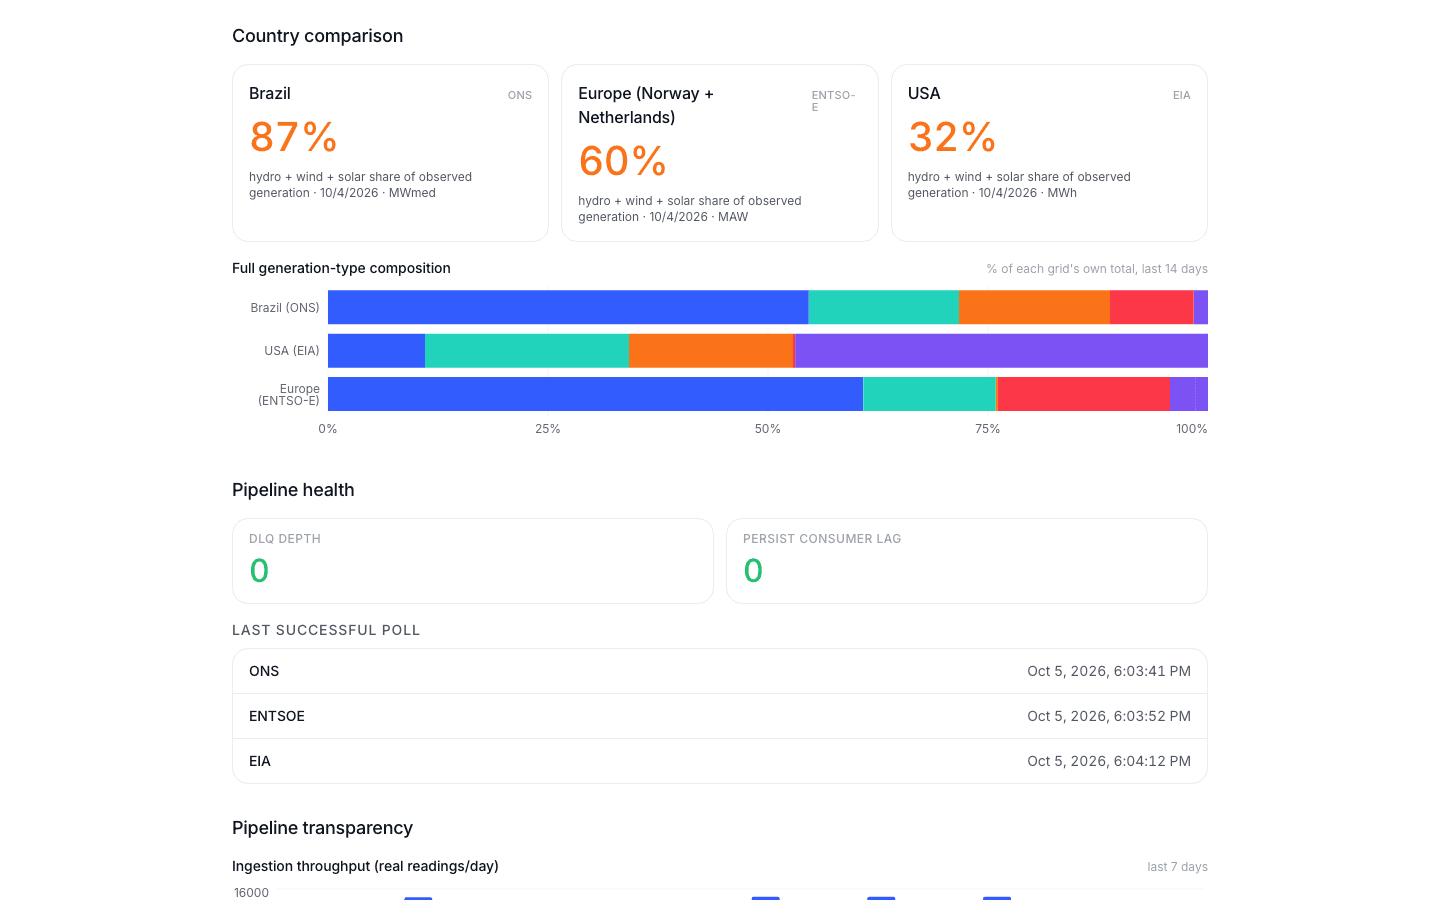
Country comparison and the pipeline-health panel: dead-letter queue depth and last successful poll per source03 / 03
Country comparison and the pipeline-health panel: dead-letter queue depth and last successful poll per source

— Delivery process

From operating constraint to shipped system

The work is sequenced around risk. Domain rules and failure states come before interface polish; automation arrives before handoff.

01

The ONS spine

Go poller, Redpanda, a persist consumer and TimescaleDB, live-verified end to end on real Brazilian plant data.

02

Reliability as a feature

Idempotent upserts, a dead-letter queue for malformed events and bounded backpressure, each verified, not assumed.

03

Europe and the USA

ENTSO-E pollers across six zones and the EIA for the US48 and seven regional grid operators, normalized to the same schema.

04

The live dashboard

Deep-dives per region, a plant map, volatility charts and a pipeline-transparency panel, with data prefetched on the server for real edge caching.

— System architecture

Clear boundaries, explicit responsibilities

Each layer has one job and a narrow contract. That keeps external services replaceable and product behavior testable.

GoRedpandaTimescaleDBTypeScriptFastifyNext.jsZod
renewable_pulse.sys● online

ons / plant-hour

366,336 readings

zero duplicates on replay

idempotency key

source · zone · asset · metric · time

●polled, said plainly

sources / 3

ons · brazil[x]
entso-e · europe[x]
eia · usa[x]
dead-letter queue[x]
synthetic data[ ]
go → redpanda → timescale
Ingest

Go pollers

One canonical event schema, hand-mirrored from the Zod contracts the TypeScript side uses.

Broker

Redpanda

Partitioned topics with independent consumer groups for persistence and live fan-out.

Storage

TimescaleDB

Idempotent writes and an hourly continuous aggregate for the charts.

Serve

Fastify REST + WebSocket

The dashboard reads REST through TanStack Query and live readings over a socket.

— What shipped

Product capabilities

01

Only real data

Every reading traces back to an ONS, ENTSO-E or EIA response; a missing source shows as missing, never as a plausible number.

02

Replays don't duplicate

Writes are keyed on source, zone, asset, metric and timestamp, so re-ingesting a batch changes nothing.

03

The pipeline shows its own health

Dead-letter depth, consumer lag and the last successful poll per source are on the dashboard, not hidden in logs.

— Engineering pressure

Challenges resolved

01

Being honest about 'real-time'

None of the sources stream; ONS republishes its plant file twice a day. The product says so, and the streaming standard is in the pipeline's engineering instead.

02

A backfill that filled the disk

The full-depth ONS backfill outgrew the database volume during live operation; the volume was resized and the incident recorded with recommendations for the next backfill.

03

Years in a different file layout

ONS switched to per-month files in 2022, so the backfill broke on earlier years until the year-file case was handled and the pilot chunk ran clean.

next transmission

Need a system this deliberate?

Bring the operating problem. We will shape it into a clear product brief and a buildable next step.

Start a project